
Intro: The history of hospitality sector may be traced back to ancient civilizations, when inns and hostels were built to accommodate tourists. In ancient Greece, for example, “tabernae” (inns) were built along main highways to give refuge for travellers and their horses. Similarly, “cauponae” were constructed in ancient Rome for the same reason.The hospitality industry has a long history, from inns and hostels in ancient civilizations to modern-day resorts. The modern hotel industry started to take shape in the 19th century starting from the rise of luxury hotels and resorts to the establishment of the first hotel management school. The industry continued to evolve with the rise of new forms of accommodation, such as motels and airport hotels. In recent decades, the industry has been impacted by the rise of home-sharing platforms.
The hospitality industry is now a global industry, with hotels and resorts located all over the world, in various types and sizes. This industry provides a wide range of options to cater to travellers’ diverse demands, from luxury resorts in tropical paradises to pocket-friendly motels along the highway.
Hotel Industry In Asia
The Asian hotel industry has grown significantly in recent years, owing to a variety of causes such as increased tourism, business travel, and a growing middle class in many Asian countries. Several of the world's most popular tourist attractions, such as China, Japan, and Thailand, are located in the region and have witnessed a steady growth in international visitors in recent years. Also, many Asian countries have experienced economic expansion, which has resulted in a rise in internal travel and a commensurate increase in demand for hotel accommodations.
One of the key drivers of growth in the hotel industry in Asia has been the rise in tourism in the region. In 2019, the number of international tourist arrivals in Asia reached over 200 million, with China, Japan, and Thailand being among the top destinations. This growth in tourism has led to an increase in demand for hotel accommodations, with hotels in the region experiencing higher occupancy rates and revenue growth.
Despite the overall growth in the hotel industry in Asia, the region has not been immune to the impacts of the COVID-19 pandemic. The pandemic has led to a decline in travel and a decrease in revenue for hotels in the region. Many hotels have had to temporarily close, while others have had to reduce their capacity to comply with social distancing guidelines. Additionally, the decline in travel has led to a decrease in demand for hotel accommodations, resulting in lower occupancy rates and revenue for hotels.
However, despite the challenges posed by the COVID-19 pandemic, the long-term outlook for the hotel industry in Asia is positive, with the region expected to continue to see growth in tourism and business travel in the coming years. The hotel industry in Asia is expected to rebound as travel restrictions are lifted and continue to see growth in the number of domestic tourists visiting the region.
Significance of the Industry
The hotel industry is an important part of the hospitality sector in Asia, and plays a significant role in the region’s economy. With a rapidly growing tourism industry, increasing business travel, and a growing middle class, the hotel industry in Asia has seen significant growth in recent years. The industry has responded to this growth by expanding rapidly, with new hotels and resorts being built to cater to the increasing demand for accommodation. In this article, we will discuss the importance of the hotel industry in Asia, its growth and development, and the challenges it faces.
Asia is a major player in the global tourism industry, with some of the most popular destinations in the world located in the region. Countries such as Thailand, Japan, and China are renowned for their unique cultures, scenic beauty, and rich history, attracting millions of tourists each year. The tourism industry in Asia is driven by both domestic and international travel, and the hotel industry is a key component of this industry. Hotels provide accommodation, food and beverage services, and other amenities to travelers, making it easier for tourists to experience the best that Asia has to offer.
The hotel industry is an important part of the hospitality sector in Asia, and plays a significant role in the region’s economy. With a rapidly growing tourism industry, increasing business travel, and a growing middle class, the hotel industry in Asia has seen significant growth in recent years. The industry has responded to this growth by expanding rapidly, with new hotels and resorts being built to cater to the increasing demand for accommodation. Despite the challenges it faces, the future of the hotel industry in Asia looks bright, and is expected to continue growing in the coming years. The industry will play a crucial role in supporting the region’s economic growth, generating jobs, and providing quality accommodation for travelers.
The Covid-19 Pandemic
The COVID-19 pandemic is a global health crisis caused by a novel strain of coronavirus, first identified in Wuhan, China in December 2019. The virus is highly contagious and can be transmitted easily from person to person through respiratory droplets. The World Health Organization (WHO) declared the outbreak a pandemic on March 11, 2020, as it rapidly spread across the globe.The virus has had a significant impact on the global population, with over 100 million confirmed cases and over 2 million deaths reported as of January 2021. The pandemic has not only caused a public health crisis, but also resulted in severe economic and social disruption. Many countries have implemented lockdowns and other measures to slow the spread of the virus, which has led to widespread job losses and economic downturns.
Covid-19 And Hotel Industry In Asia
The COVID-19 pandemic has had a profound impact on the hotel industry in Asia and across the world. One of the most significant impacts of the COVID-19 pandemic on the hotel industry in Asia has been a decline in demand for hotel rooms. The measures implemented to curb the spread of the virus, such as lockdowns, travel restrictions, and quarantine requirements, have made it difficult for people to travel for both leisure and business purposes. This has resulted in a significant drop in the number of travelers, and as a result, a decline in demand for hotel rooms. In addition, many events and conferences that would typically attract large numbers of travelers have been cancelled or postponed, further reducing demand for hotel rooms.The decline in demand for hotel rooms has had a significant impact on the revenue of hotels in Asia. With fewer travelers and lower occupancy rates, hotels have been forced to reduce their room rates in order to remain competitive. This has resulted in a decrease in revenue for hotels and has made it difficult for many hotels to maintain their operations. In addition, the cost of operating hotels has increased as a result of the measures implemented to ensure the safety of guests, such as increased cleaning and sanitization procedures.
The COVID-19 pandemic has had a significant impact on the tourism industry in Asia. With travel restrictions and quarantine requirements in place, many travelers have been unable to visit the region. This has resulted in a decline in international tourism and has had a significant impact on the economies of many countries in Asia that rely heavily on tourism. In addition, the decline in tourism has had a ripple effect on other industries, such as the hospitality and retail sectors, further exacerbating the economic impact of the pandemic.
The impact of the pandemic has also been felt by hotel owners and investors, who have struggled to meet their financial obligations and secure financing for their operations. The Decline In Tourism Has Had A Significant Impact On The Economies.
Recovery Of The Indutry from Pandemic
The recovery of the hotel industry in Asia from the pandemic will depend on several factors, including the pace of the vaccine rollout, the success of public health measures in controlling the spread of the virus, and the return of consumer confidence. In many Asian countries, the vaccine rollout is underway, and this is providing a much-needed boost to the industry. As more people become vaccinated, international travel is expected to pick up, which will increase demand for hotel rooms.In addition to the vaccine rollout, the success of public health measures in controlling the spread of the virus will also be important in the recovery of the hotel industry. Countries with lower rates of COVID-19 transmission will be more attractive to tourists, and this will drive demand for hotel rooms. The adoption of new health and safety measures, such as increased cleaning protocols, will also be important in restoring consumer confidence and encouraging people to return to hotels. The recovery of the hotel industry in Asia from the COVID-19 pandemic will be a gradual process that will depend on several factors, including the pace of the vaccine rollout, the success of public health measures in controlling the spread of the virus, and the return of consumer confidence. Despite the challenges, the industry is poised for a recovery in the coming months and years, and it is expected to return to pre-pandemic levels of demand and revenue in the long-term.
The Vaccionation Drive
The COVID-19 vaccination drive is expected to have a positive impact on the hotel industry stocks in Asia. The widespread rollout of vaccines is seen as a crucial step in controlling the spread of the virus and restoring consumer confidence in travel and hospitality. The vaccine rollout will help to control the spread of the virus and reduce the risk of future outbreaks, which will help to increase consumer confidence in travel and hospitality. This, in turn, will make it easier for investors to make informed decisions about hotel industry stocks, leading to more stable and predictable performance.The successful rollout of vaccines will help to restore consumer confidence and increase demand for hotel rooms, leading to higher revenue for hotel companies and a corresponding improvement in the performance of hotel industry stocks. The success of the vaccine rollout will also reduce uncertainty surrounding the future of the industry, making it easier for investors to make informed decisions and leading to more stable and predictable performance.
LITERATURE REVIEW-
(Rouatbi et al., 2021 investigated the relationship between COVID-19 vaccinations and stock market volatility by applying panel regression analysis to estimate the effect of vaccination rates on stock market volatility.The study includes various control variables such as infection rates, government policies, and economic conditions, to account for other factors that could affect stock market volatility.The study found out that this effect is more significant in developed economies, suggesting that the economic development of a country influences the effect of vaccinations on stock market volatility.(Nguyen et al., 2023). examines the relationship between COVID-19 vaccination campaigns and stock market volatility. The study uses a time-series regression analysis to estimate the impact of vaccination campaigns on stock market volatility in four countries – the United States, Japan, South Korea, and Singapore. The data used in the analysis covers the period from December 2020 to March 2021, which corresponds to the initial phase of the COVID-19 vaccination campaigns in these countries. The study finds that COVID-19 vaccination campaigns have had a significant impact on stock market volatility in the four countries analyzed. (Dube, 2022)examines the potential effects of vaccine-induced recovery on the global tourism industry, as well as the implications of vaccine apartheid for the industry.The findings of the study showed that vaccine-induced recovery has the potential to revitalize the tourism industry, with an increase in travel demand, a rise in consumer confidence, and a boost in the overall economy. However, the study also revealed that vaccine apartheid could pose a significant challenge for the industry, with the unequal distribution of vaccines leading to disparities in access to travel and tourism. According to (Williams et al., 2021) the PMT constructs, including perceived severity of COVID-19, perceived vulnerability to COVID-19, response efficacy of the vaccine, and self-efficacy to get the vaccine, were positively associated with vaccine confidence. In turn, vaccine confidence was positively associated with travel intentions. The authors also found that PMT segmentation analysis could be used to identify different groups of tourists with different levels of vaccine confidence, travel intentions, and socio-demographic characteristics.(Gautam, 2021)showed in their study that the COVID-19 pandemic has had a significant impact on the hospitality and tourism sector in India, leading to a decrease in the number of tourists and revenue for the industry. The study also revealed that the pandemic has resulted in job losses, reduced working hours, and decreased salaries for the employees of the industry.(Gursoy& Chi, 2020).highlighted the need for international cooperation in addressing the impact of the pandemic on the hospitality industry, given the global nature of the industry.(Kohlmayr,2021). examined in their paper the crucial role that vaccination rates play in the recovery of the hospitality industry. The author notes that vaccination rates have a significant impact on the industry’s recovery, particularly in regions where the pandemic is still raging.(Oteng Agyeman et al., 2022) revealed in their paper of a poll of Chinese travellers to better understand their sentiments towards the COVID-19 vaccine and its impact on their travel intentions. According to the findings, the majority of respondents are willing to get vaccinated, with 84.8% willing to take the vaccination.(Wang & Chen, 2022) conducted survey among travelers in China to understand their decision-making process when selecting hotels. The survey uses a fuzzy multi-criteria decision-making approach to analyze the factors that influence travelers' decisions, including location, price, safety, and vaccination requirements.
Research Methodology- The research objectives for a study on the effect of the vaccination drive on the hotel industry stocks of Asia could include:
Hypothesis
The null and alternative hypothesis for the effect of vaccination drive on the hotel industry in Asia could be:
Null Hypothesis (H0): There is no significant difference in the mean performance of the hotel industry in Asia before and after the vaccination drive.
Alternative Hypothesis (Ha): There is a significant difference in the mean performance of the hotel industry in Asia before and after the vaccination drive.
The result for t test for an event study on the effects of covid-19 vaccination drive on the hotel industry in Asia came out to be insignificant i.e. less than 1.96 at 95% confidence level.
This study uses the event study methodology to examine the impact of the news about the coronavirus vaccination drive initialization on financial markets, specifically the stock markets. The event study methodology is a widely used and appropriate tool for evaluating the effects of an event on securities returns over a specified period. This approach enables researchers to forecast how securities and indices will perform in response to an event, whether the impact will be positive or negative on stock prices. Typically, the event study methodology is used to analyze the relationship between corporate events like mergers and acquisitions, stock dividends, and other external factors that affect a company’s performance. However, the event study approach has also been used to investigate the influence of non-corporate events, such as disease outbreaks, on stock markets. Prior studies have shown that the event study methodology is the most reliable tool for estimating ARs, which is crucial for understanding the effects of an event announcement on stock prices.
Event Of Interest And Event Date
Several studies have attempted to investigate the short-term effect of the COVID-19 outbreak on stock market returns. In the same way, the event of interest for this study is the initialization of the COVID-19 vaccination drive in Asian countries and how it affected the hospitality industry stocks. The event date for each country will differ because the vaccination drive was on different dates in each country across Asia. For this study, we have selected the starting date of the vaccination drive for the public or high-risk people and not the date from which emergency use was approved.Therefore, the event date in this study is chosen for this the selected countries listed in the following table:
| S NO. | COUNTRY | START DATE (T0) |
| 1 | INDIA | 16/01/2021 |
| 2 | CHINA | 15/12/2020 |
| 3 | THAILAND | 28/02/2021 |
| 4 | JAPAN | 17/02/2021 |
| 5 | SOUTH KOREA | 26/02/2021 |
| 6 | INDONESIA | 13/01/2021 |
| 7 | SINGAPORE | 30/12/2020 |
| 8 | HONG KONG | 25/01/2021 |
| 9 | MALAYSISA | 24/02/2021 |
| 10 | ISRAEL | 20/12/2020 |
| 11 | BANGLADESH | 27/01/2021 |
| 12 | SAUDI ARABIA | 17/12/2020 |
| 13 | TAIWAN | 22/03/2021 |
| 14 | SRI LANKA | 29/01/2021 |
| 15 | MACAU | 09/02/2021 |
| 16 | CAMBODIA | 10/02/2021 |
TABLE 1: THE STARTING DATE OF VACCINATION DRIVE IN EACH COUNTRY
SOURCE: WHO Portal, and Government portals.
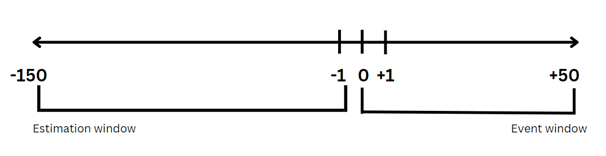
Event Window And Estimation Window
The event window and estimation chosen for this study is 201 days, which includes 150 days prior to the event which is the estimation period and 50 days post-event which is the event window. The impact of the COVID-19 pandemic on stock returns is longer than that of corporate events. The stock markets may behave differently in different phases of the pandemic cycle. Therefore, to examine the influence of outbreak on different periods, the entire event window is subdivided into five windows for pre-event and post-event: (0–9), (10–20), (21–30), (31–40), and (41–50).
Estimation Model
In the first step of the event study, we calculate the daily return using Equation (1):
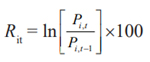
where Ri,t is the return for index i on day t, ln is the natural logarithm, Pi,t denotes the closing price for an index i on day t, and Pi,t-1 is the closing price of index i in the previous trading day.
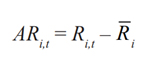
After deriving the expected mean return [EI], AR for each day for each index is calculated using Equation (2):
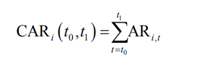
Cumulative abnormal return (CAR) of index i over a window from t 0 to t 1 is calculated using Equation (3):
Average abnormal returns (AAR) are calculated using Equation (4), where we compute the arithmetic average of Ars for all the indices on each event day. N represents the number of indices.
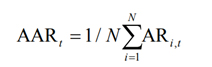
To investigate the accumulated impacts of the event during a specified time period, cumulative average abnormal returns (CAARs) are obtained. CAAR refers to the aggregate of daily AARs for the pre-defined event window (t 0 – t 1 ). CAAR for the pre-specified window is calculated using Equation (5):
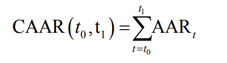
The standard deviation is calculated using the time series of AARs of the estimation period, as shown in Equation (6):
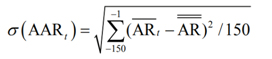
Were,
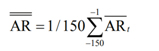
And
Sampling And Data Collection
Data collection is the process of collecting the required data for analysis. In this case, the data collected would be the closing stock prices of hotel companies in Asia and the closing price of the dow jones industrial average before and after the vaccination drive.The data collected should be standardized using a standard metric to compare the hotel industry stocks in Asia with the Dow Jones Industrial Average. This study is done by converting the stock prices to percentage change and comparing the percentage change in the hotel industry with that of the Dow Jones Industrial Average.
Mean Return Of The Stocks
| PART A | ||||
| S NO. | COUNTRY | NO. OF TRADING DAYS | EVENT GROUP’S MEAN | EVENT GROUPS STD. DEVIATION |
| 1 | INDIA | 149 | 0.00338 | 0.02853 |
| 2 | CHINA | 149 | 0.00451 | 0.02935 |
| 3 | THAILAND | 149 | -0.00084 | 0.02409 |
| 4 | JAPAN | 149 | 0.00050 | 0.01737 |
| 5 | SOUTH KOREA | 149 | 0.00123 | 0.01881 |
| 6 | INDONESIA | 149 | 0.00098 | 0.03994 |
| 7 | SINGAPORE | 149 | 0.00031 | 0.02493 |
| 8 | HONG KONG | 149 | 0.00116 | 0.02160 |
| 9 | MALAYSIA | 149 | -0.00108 | 0.02394 |
| 10 | ISRAEL | 149 | 0.00108 | 0.02335 |
| 11 | BANGLADESH | 149 | 0.00190 | 0.03156 |
| 12 | SAUDI ARABIA | 149 | 0.00547 | 0.03044 |
| 13 | TAIWAN | 149 | 0.00134 | 0.01488 |
| 14 | SRI LANKA | 149 | 0.00478 | 0.03515 |
| 15 | MACAU | 149 | -0.00014 | 0.02329 |
| 16 | CAMBODIA | 149 | 0.00044 | 0.02378 |
TABLE 2: MEAN AVERAGE RETURN PRE-EVENT
| PART B | ||||
| S NO. | COUNTRY | NO. OF TRADING DAYS | EVENT GROUP’S MEAN | EVENT GROUPS STD. DEVIATION |
| 1 | INDIA | 50 | -0.002095335 | 0.022671564 |
| 2 | CHINA | 50 | 0.00064219 | 0.035110997 |
| 3 | THAILAND | 50 | 0.002942015 | 0.02266488 |
| 4 | JAPAN | 50 | 0.000209024 | 0.016212438 |
| 5 | SOUTH KOREA | 50 | 0.002979037 | 0.012976911 |
| 6 | INDONESIA | 50 | 0.00094511 | 0.029092234 |
| 7 | SINGAPORE | 50 | 0.000190437 | 0.01978975 |
| 8 | HONG KONG | 50 | 0.003411094 | 0.016294827 |
| 9 | MALAYSIA | 50 | 0.00240228 | 0.013924421 |
| 10 | ISRAEL | 50 | 0.003891285 | 0.017902173 |
| 11 | BANGLADESH | 50 | -0.002310993 | 0.033105715 |
| 12 | SAUDI ARABIA | 50 | -0.00096952 | 0.033430851 |
| 13 | TAIWAN | 50 | -0.001766548 | 0.016667119 |
| 14 | SRI LANKA | 50 | -0.002053947 | 0.03535145 |
| 15 | MACAU | 50 | 0.001405958 | 0.024235564 |
| 16 | CAMBODIA | 50 | -0.002034224 | 0.027464581 |
TABLE 3: MEAN AVERAGE RETURN POST EVENT DAY
SOURCE: The author.
The mean returns and standard deviation corresponding to the hotel industry stocks in Asia are shown in Table 1 & 2. Table 1 shows the pre-event mean and standard deviation and table 2 shows post-event mean and standard deviation. All the countries show a positive mean return except three countries which are Thailand, Malaysia, and Macau as seen in Table 1. After the vaccination drive the returns are expected to be seen increasing or get positive from negative. In the table 2 we can see that most of the countries have seen slight improvement in the mean returns and also the standard deviation has also decreased slightly compared to the pre-covid-19 vaccination drive levels. Although India, Bangladesh, Taiwan, Sri lanka, Saudi Arabia, and Cambodia, which showed positive returns before the vaccination drive are now showing negative results. Macau, Thailand, and Malaysia however recovered and are now showing positive returns.
Hence, we can say that the Covid-19 vaccination drive affected the stocks of the hotel industry in a positive way to an extent affecting some countries in a negative way.
Abnormal Returns
| ABNORMAL RETURN % | ||
| COUNTRIES | T0 | T1 |
| INDIA | 0.0022 | -0.0305 |
| CHINA | 0.0116 | 0.0547 |
| THAILAND | -0.0158 | -0.0002 |
| JAPAN | 0.0079 | 0.0170 |
| SOUTH KOREA | -0.0191 | 0.0049 |
| INDONESIA | -0.0006 | -0.0002 |
| SINGAPORE | -0.0003 | -0.0003 |
| HONG KONG | -0.0174 | 0.0070 |
| MALAYSIA | 0.0025 | -0.0138 |
| ISRAEL | -0.0271 | -0.0376 |
| BANGLADESH | 0.0040 | 0.0257 |
| SAUDI ARABIA | -0.0197 | -0.0158 |
| TAIWAN | -0.0070 | -0.0054 |
| SRI LANKA | -0.0042 | -0.0394 |
| MACAU | 0.0258 | 0.0107 |
| CAMBODIA | -0.0085 | -0.0115 |
TABLE 4: Abnormal returns on the event day and 1 day post-event.
SOURCCE: The author.
In the table 3, there are Abnormal returns of the event day and one day post event. The countries are showing negative absolute returns on the event day. The absolute returns of the next day (T1) are seen to be improved from T010 countries showed a positive improvement on the absolute returns, some of them going from negative to positive and some showed lesser losses which is also a positive indicator. However 6 countries which are India, Malaysia, Israel, Sri Lanka, Cambodia, and Macau showed negative results.
All the stocks show some amount of fluctuation from day 0 to day 50. Sri Lanka’s stock showed the highest amount of improvement of 8.41% followed by Bangladesh and China. India on the other hand showed hight downfall of 14.9% which is the highest amongst the 6 countries.
Hence, we can conclude that the news about the vaccination drive had a positive effect on most of the hotel industry stocks in Asia.
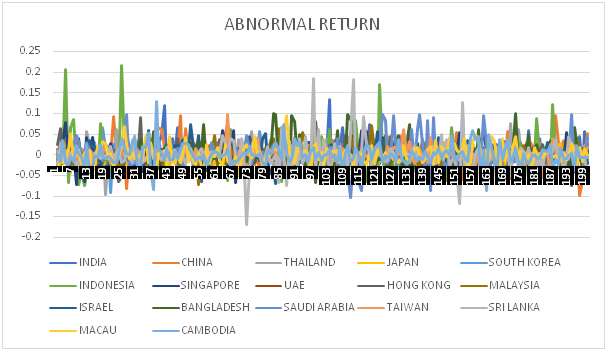
FIGURE 1: Graph of abnormal returns of each country for estimation window and event window.
SOURCE: The authors.
The above chsrt shows the Abnormal returns from the -150 till +50. We can see from the above graph that the variations were very high before the event day and post that they got streamlined and vary from -0.1% till 0.1% at most. This can be considered that market has stabilized a bit from the news of the covid-19 vaccination drive. The announcement of COVID-19 vaccinations did not lead to a significant movement in airline stocks, despite initial optimism. There are several factors that could explain this lack of movement:
1. Uncertainty surrounding the distribution and effectiveness of the vaccines: Although the announcement of the vaccines was seen as a positive step towards a return to normalcy, there was still uncertainty surrounding the distribution and efficacy of the vaaccines, particularly in regards to the timeline for widespread distribution and the percentage of the population that would take the vaccine.
2. Persistence of COVID-19 cases and travel restrictions: Despite the announcement of vaccines, COVID-19 cases continued to persist and new variants of the virus were discovered, leading to the implementation of new travel restrictions and lockdowns. These developments added to the uncertainty surrounding the travel industry and dampened any positive sentiment from the vaccine announcement.
3. Pre-existing financial difficulties for airlines: The COVID-19 pandemic had already caused significant financial difficulties for many airlines, and the uncertainty surrounding the impact of the pandemic was ongoing. This made it difficult for airlines to make long-term plans and investments, despite the vaccine announcement.
Cumulative Abnormal Return
PRE-EVENT DAY
| COUNTRIES | CAR (40-50) |
| INDIA | -0.01208203 |
| CHINA | 0.065431531 |
| THAILAND | -0.014538019 |
| JAPAN | -0.019262168 |
| SOUTH KOREA | -0.013348754 |
| INDONESIA | -9.53085E-05 |
| SINGAPORE | -0.053908788 |
| HONG KONG | -0.113811239 |
| MALAYSIA | -0.080566668 |
| ISRAEL | 0.004509299 |
| BANGLADESH | -0.064646672 |
| SAUDI ARABIA | -0.086620678 |
| TAIWAN | 0.065378505 |
| SRI LANKA | 0.005626316 |
| MACAU | 0.126297179 |
| CAMBODIA | 0.040510075 |
TABLE 5: CAAR’s from day 40-50 prior to the event day.
SOURCCE: The author.
The Compound Annual Returns (CAR) for a specific period, days 40-50, appear to be predominantly negative, with 10 out of 16 countries displaying a downward trend. A negative CAR implies that the investment has lost value over the given period, while a positive CAR indicates a gain in value. Therefore, if the majority of countries are showing negative CARs, it suggests that the investments in these countries have generally declined in value over that period.It is also worth noting that a negative CAR over a specific period does not necessarily indicate a poor long-term investment. Short-term investment returns can be unpredictable, and it is essential to assess the investment's overall performance over an extended period to determine its potential for long-term growth. Ultimately, investors should exercise caution and conduct thorough research before making any investment decisions.
| COUNTRIES | CAR (30-39) |
| INDIA | -0.029211697 |
| CHINA | -0.111611074 |
| THAILAND | 0.000379762 |
| JAPAN | -0.013561783 |
| SOUTH KOREA | -0.040271616 |
| INDONESIA | -0.015208638 |
| SINGAPORE | 0.026299943 |
| HONG KONG | -0.061207668 |
| MALAYSIA | -0.076046863 |
| ISRAEL | -0.07006861 |
| BANGLADESH | -0.03085071 |
| SAUDI ARABIA | 0.285016383 |
| TAIWAN | 0.060462631 |
| SRI LANKA | 0.015946858 |
| MACAU | -0.003233977 |
| CAMBODIA | -0.073019561 |
TABLE 6: CAAR’s from day 30-39 prior to the event day.
SOURCCE: The author.
During this window from day 30-39 pre-event 11 out of 16 countries are having neative performance. Macau and Cambodia which were earlier showing positive growth of 0.040 and 0.126 respectively are now showing negative performance. Saudi Arabia was showing a negative growth of -0.0866 is now positive at 0.285. Israel was also showing a positive performance but now it has also gone negative. Singapore was showing negative performance earlier but now it has also gone positive. Finally, China which was earlier performing positively is showing negative results in this window.
| COUNTRIES | CAR (20-29) |
| INDIA | -0.031588334 |
| CHINA | 0.104301019 |
| THAILAND | 0.002199972 |
| JAPAN | -0.096782314 |
| SOUTH KOREA | -0.015310124 |
| INDONESIA | 0.069079119 |
| SINGAPORE | 0.039840588 |
| HONG KONG | 0.040209316 |
| MALAYSIA | 0.030278322 |
| ISRAEL | 0.106580739 |
| BANGLADESH | 0.057151238 |
| SAUDI ARABIA | 0.276929958 |
| TAIWAN | 0.074127468 |
| SRI LANKA | -0.026880898 |
| MACAU | -0.048635332 |
| CAMBODIA | 0.034792002 |
TABLE 7: CAAR’s from day 20-29 prior to the event day.
SOURCCE: The author.
During this window from day 20-29 pre-event 5 out of 16 countries are showing a negative return. This is a significant improvement over the previous window where 11 countries were showing negative results. Only India, Japan, South Korea, Sri Lanka, and Macau are showing a negative return. China which went negative during the last window is now positive again same as with Indonesia, Hong Kong, Malaysia, Israel, Bangladesh, and Cambodia.
| COUNTRIES | CAR (10-19) |
| INDIA | 0.082682808 |
| CHINA | 0.094319046 |
| THAILAND | 0.090195306 |
| JAPAN | 0.023175831 |
| SOUTH KOREA | 0.03695377 |
| INDONESIA | -0.030789663 |
| SINGAPORE | 0.090493582 |
| HONG KONG | 0.000481359 |
| MALAYSIA | 0.165547187 |
| ISRAEL | 0.016630268 |
| BANGLADESH | 0.067935877 |
| SAUDI ARABIA | -0.284698231 |
| TAIWAN | -0.026762882 |
| SRI LANKA | 0.326463481 |
| MACAU | -0.063087743 |
| CAMBODIA | 0.003108245 |
TABLE 8: CAAR’s from day 10-19 prior to the event day.
SOURCCE: The author.
During this window from day 10-19 only 4 countries out of 16 countries are showing a negative performance. India which was performing negatively till now has finally gone positive. Indonesia on the other hand was positive during the last window but now went negative same as with Saudi Arabia, and Taiwan. We can also observe that the other countries have maintained their prior positive growth with a bit deviation. India and Malaysia showed a good positive movement of about 0.1% which was the maximum.
We can see that as we get closer to the event day the returns are either getting positive or getting stabilised rather than varying a lot.
| COUNTRIES | CAR (0-9) |
| INDIA | 0.119541306 |
| CHINA | -0.057383271 |
| THAILAND | 0.003348051 |
| JAPAN | 0.05028523 |
| SOUTH KOREA | -0.072605023 |
| INDONESIA | -0.025208654 |
| SINGAPORE | -0.031762488 |
| HONG KONG | 0.053715571 |
| MALAYSIA | -0.116239994 |
| ISRAEL | -0.01352594 |
| BANGLADESH | -0.074604968 |
| SAUDI ARABIA | -0.021988004 |
| TAIWAN | -0.017787423 |
| SRI LANKA | -0.022894746 |
| MACAU | 0.004976376 |
| CAMBODIA | -0.023944798 |
TABLE 9: CAAR’s from day 0-10 prior to the event day.
SOURCCE: The author.
We can observe that the returns of the market suffered a hit and during the period of ten days prior to the event day, 11 out of 16 countries showed a negative result. India, Japan, Hong Kong, and Macau are some exceptions which showed a positive growth in these ten days. Indonesia, Saudi Arabia although are still negative but went up slightly, thus showing very slight recovery.This variation in data is sign of some event which happened and affected the positive growyh of the markets.This also shows that the event which we selected might have less significant impact on the stock market.
POST THE EVENT DAY
| COUNTRIES | CAR (0-9) |
| INDIA | -0.031331983 |
| CHINA | -0.094302933 |
| THAILAND | -0.016415034 |
| JAPAN | 0.102036373 |
| SOUTH KOREA | -0.017526522 |
| INDONESIA | -0.07419918 |
| SINGAPORE | 0.026650149 |
| HONG KONG | -0.068285556 |
| MALAYSIA | 0.017324201 |
| ISRAEL | 0.034670465 |
| BANGLADESH | -0.037337645 |
| SAUDI ARABIA | -0.091048023 |
| TAIWAN | -0.054365023 |
| SRI LANKA | -0.08443494 |
| MACAU | 0.147322451 |
| CAMBODIA | 0.146839838 |
TABLE 10: CAR’s for ten days post the event day.
SOURCCE: The author.
According to the table above, the cumulative abnormal returns (CAR) for a range of stocks during the first ten days of an event window are mostly negative. However, there are a few exceptions, such as Macau, Cambodia, Israel, Malaysia, Singapore, and Japan, which generated positive CAR values during this period. In particular, Macau had the highest return of 0.147, indicating that the news about the vaccination drive had a positive effect. On the other hand, China had the lowest CAR, which was negative at -0.094, implying that the news about the vaccination drive did not have any effect. Overall, these results suggest that while some stocks performed well during the early stages of the event window, others experienced declines in value. The trend of the market is still negative and 10 out of 16 countries still showed a negative result.
| COUNTRIES | CAR (10-19) |
| INDIA | 0.018598095 |
| CHINA | -0.062761568 |
| THAILAND | 0.009112422 |
| JAPAN | 0.002596982 |
| SOUTH KOREA | 0.026294295 |
| INDONESIA | 0.005449285 |
| SINGAPORE | 0.077024756 |
| HONG KONG | 0.065290222 |
| MALAYSIA | -0.002004389 |
| ISRAEL | 0.038768816 |
| BANGLADESH | -0.057691154 |
| SAUDI ARABIA | 0.029057182 |
| TAIWAN | -0.015878045 |
| SRI LANKA | -0.119508718 |
| MACAU | -0.019658615 |
| CAMBODIA | -0.086580535 |
TABLE 11: CAR’s table for the ten days post ten days after the event day.
SOURCCE: The author.
The table above provides information about the cumulative abnormal returns (CAR) for a range of stocks during the ten days following the first ten days of an event window. The data reveals that in total, ten countries saw positive results during this period, indicating that the news had a positive impact on the market and investor sentiment. However, the remaining six countries, namely Japan, Malaysia, Bangladesh, Sri Lanka, Macau, and Cambodia, experienced negative returns over the same period.
High degree of variation is observed in the performance of South Korea and Singapore. South Korea saw a significant improvement in its CAR, moving from -0.0117 to 0.026, indicating that investors regained confidence in this market over the ten-day period. Similarly, Singapore saw a notable increase in its CAR, rising from 0.026 to 0.077. In contrast, the six countries mentioned earlier showed negative CAR values during the ten-day period, suggesting that investor confidence in these markets was weaker.
Overall, these findings suggest that while some markets responded positively to the news during the second phase of the event window, others experienced further declines in their CAR. This highlights the complex and varied nature of stock market performance, which is influenced by a range of economic, political, and social factors.
| COUNTRIES | CAR (20-29) |
| INDIA | -0.058261958 |
| CHINA | 0.02261743 |
| THAILAND | 0.137945872 |
| JAPAN | -0.06838667 |
| SOUTH KOREA | -0.04069513 |
| INDONESIA | -0.059849139 |
| SINGAPORE | -0.02712367 |
| HONG KONG | 0.013930273 |
| MALAYSIA | 0.063831682 |
| ISRAEL | -0.023802199 |
| BANGLADESH | 0.116096024 |
| SAUDI ARABIA | -0.065780124 |
| TAIWAN | -0.055171483 |
| SRI LANKA | -0.021805646 |
| MACAU | -0.035426102 |
| CAMBODIA | -0.077010691 |
TABLE 12: CAR’s table for day 20-29 post the event day.
SOURCCE: The author.
The table above provides insights into the cumulative abnormal returns (CAR) for a range of stocks during the 20-29 day period from the event day. The data reveals that, during this time frame, 11 countries experienced a negative return, with only China, Thailand, Malaysia, Bangladesh, and Cambodia managing to maintain a positive trend.
Of these, Thailand had the highest return and continued to grow positively during this period, followed by China and Malaysia. However, India experienced a decline, moving from positive to negative returns, with Japan, South Korea, Indonesia, Singapore, Israel, and Saudi Arabia all facing similar situations.
Overall, these findings suggest that, during this period, a significant number of countries experienced negative returns, while only a handful managed to maintain a positive trend. The results highlight the volatility of the stock market and the potential risks that come with investing in stocks.
It is worth noting that many factors can impact stock prices, including global economic conditions, political developments, and changes in investor sentiment. Nonetheless, these findings provide some insights into how these stocks performed during this period, which may be of interest to investors who are looking to make informed decisions about their investments.
| COUNTRIES | CAR (30-39) |
| INDIA | -0.018713236 |
| CHINA | 0.086397564 |
| THAILAND | -0.089232532 |
| JAPAN | -0.002451836 |
| SOUTH KOREA | -0.033943406 |
| INDONESIA | 0.208010019 |
| SINGAPORE | -0.040885137 |
| HONG KONG | 0.075849821 |
| MALAYSIA | -0.011154064 |
| ISRAEL | 0.034307976 |
| BANGLADESH | -0.094682438 |
| SAUDI ARABIA | -0.143518401 |
| TAIWAN | -0.0770076 |
| SRI LANKA | 0.007398932 |
| MACAU | 0.0008671 |
| CAMBODIA | -0.0414373 |
TABLE 13: The CAR’s table for day 30-39 post the event day.
SOURCCE: The author.
The table above provides insights into the cumulative abnormal returns (CAR) for a range of stocks during the 30-39 day period from the event day. The data reveals that some stocks have seen a recovery in their performance during this time period. Specifically, India, Japan, South Korea, Indonesia, Israel, Saudi Arabia, Sri Lanka, Macau, and Cambodia all showed signs of improvement in their CAR values.Additionally, China's performance has been consistent, maintaining steady positive growth since the event day and continuing this trend in the 30-39 day period. Hong Kong also followed a similar pattern of steady positive growth during this phase.Thailand had been performing consistently in the previous period, but its CAR value showed a slight decline in the 30-39 day period, going slightly negative.Overall, these findings suggest that while some stocks have seen a recovery in their performance, others have maintained steady positive growth. Meanwhile, Thailand's performance showed a slight dip during this period.
| COUNTRIES | CAR (40-50) |
| INDIA | -0.071313635 |
| CHINA | -0.132344572 |
| THAILAND | 0.08003326 |
| JAPAN | -0.040891482 |
| SOUTH KOREA | 0.104138578 |
| INDONESIA | -0.076359377 |
| SINGAPORE | -0.040011817 |
| HONG KONG | -0.041853781 |
| MALAYSIA | 0.032123759 |
| ISRAEL | 0.043535056 |
| BANGLADESH | -0.100185461 |
| SAUDI ARABIA | -0.024291425 |
| TAIWAN | 0.064248078 |
| SRI LANKA | 0.005672422 |
| MACAU | -0.022550833 |
| CAMBODIA | -0.039423033 |
TABLE 14: The CAR’s of day 40-50 post the event day.
SOURCCE: The author.
The table above provides insights into the cumulative abnormal returns (CAR) for a range of stocks during the final phase of the event window, covering days 40 to 50. The data shows that most countries performed positively during this time frame, indicating that investor confidence had returned to these markets. However, India experienced a negative result, with China, Japan, Indonesia, Hong Kong, and Macau also showing declines in their CAR. Hong Kong, which had been performing positively until this point, also saw a negative trend during this phase.
In contrast, Thailand managed to recover and achieved a positive CAR during the final phase of the event window. Similarly, South Korea followed a similar pattern, with a recovery in its CAR during this period.
Overall, it appears that the stocks have performed reasonably well from the event day until the end of the event window. It is worth noting that the high variations in prices seen before the event day were not observed during this phase, suggesting that the stocks may have stabilised. This may signal a potential trend reversal soon.
The stock market is influenced by a wide range of factors, including economic conditions, political stability, and investor sentiment. These factors can impact stock prices in unpredictable ways. Nonetheless, the data from the event window suggests that investors have responded positively to the news about the vaccination drive, and many of the stocks have performed well during this period.
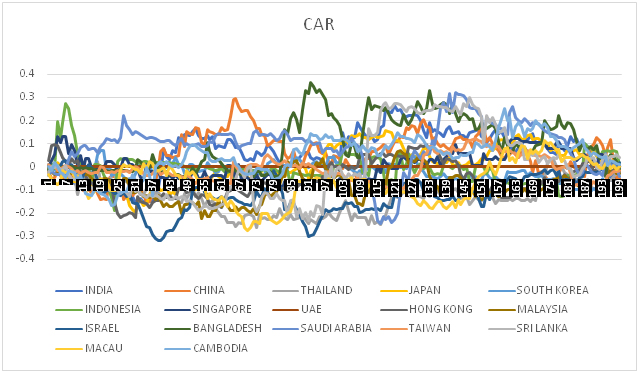
FIGURE 2: Line graph representing all the CAR values for the estimation window and event window.
SOURCE: The author.
The CAR (Cumulative Abnormal Return) graph is a tool used in finance to analyze the performance of a stock or group of stocks over time. In this case, we are looking at the stock prices of the hotel industry before and after the introduction of a COVID-19 vaccine.
Before the vaccine was introduced, the CAR graph for stocks in the hotel industry was very varying, meaning that the stocks were experiencing significant fluctuations in their abnormal returns. This may have been due to the uncertainty and unpredictability of the pandemic, which had a major impact on the travel and hospitality industry.
However, after the introduction of the vaccine, the CAR graph for hotel industry stocks started to consolidate, indicating that the stocks were experiencing more stable and consistent abnormal returns. This may be due to the positive impact of the vaccine on the travel and hospitality industry, as people may have been more willing to travel and stay in hotels after being vaccinated. Overall, the CAR graph can be a useful tool for analyzing the performance of stocks over time and identifying trends and patterns that can inform investment decisions.
Calculation of T-Statistic For Average Abnnormal Return and Cumalative Average Abnormal Return
| AAR | TAAR STATISTIC | CAAR | TCAAR STATISTIC |
| -0.00411 | -0.160331305 | -0.00411 | -0.67613 |
| -0.00216 | -0.05963869 | -0.00628 | -0.2515 |
| -0.01017 | -0.22895937 | -0.01645 | -0.96553 |
| 0.0088 | 0.171557004 | -0.00765 | 0.723465 |
| 0.002995 | 0.052226848 | -0.00465 | 0.220243 |
| -0.00157 | -0.024970845 | -0.00622 | -0.1053 |
| -0.00493 | -0.072618877 | -0.01115 | -0.30624 |
| -0.00313 | -0.04316237 | -0.01428 | -0.18202 |
| 0.000831 | 0.010800798 | -0.01345 | 0.045548 |
| 0.007547 | 0.093056335 | -0.0059 | 0.392423 |
| -0.00384 | -0.04513419 | -0.00974 | -0.19033 |
| 0.003989 | 0.044893416 | -0.00575 | 0.189318 |
| -0.00547 | -0.059141669 | -0.01122 | -0.2494 |
| 0.002191 | 0.022834529 | -0.00903 | 0.096294 |
| 0.002852 | 0.028716052 | -0.00618 | 0.121097 |
| 0.000539 | 0.005256875 | -0.00564 | 0.022169 |
| -0.00163 | -0.015449428 | -0.00727 | -0.06515 |
| -0.00362 | -0.033270399 | -0.01089 | -0.1403 |
| -0.00049 | -0.004383383 | -0.01138 | -0.01848 |
| -0.00026 | -0.002288876 | -0.01164 | -0.00965 |
| 0.006018 | 0.051202691 | -0.00563 | 0.215924 |
| -0.00283 | -0.023550146 | -0.00846 | -0.09931 |
| -0.00078 | -0.006305196 | -0.00923 | -0.02659 |
| 0.011425 | 0.09092889 | 0.002191 | 0.383452 |
| -0.00964 | -0.075166655 | -0.00745 | -0.31698 |
| -0.00133 | -0.010167843 | -0.00878 | -0.04288 |
| -0.00205 | -0.015354183 | -0.01082 | -0.06475 |
| -0.00384 | -0.028317096 | -0.01467 | -0.11941 |
| 0.003293 | 0.023845544 | -0.01137 | 0.100558 |
| -0.01145 | -0.081510707 | -0.02282 | -0.34373 |
| -9.2E-05 | -0.000643063 | -0.02292 | -0.00271 |
| 0.001818 | 0.012529469 | -0.0211 | 0.052837 |
| -0.00249 | -0.016902736 | -0.02359 | -0.07128 |
| -0.01132 | -0.075708626 | -0.03491 | -0.31927 |
| -0.00867 | -0.057144789 | -0.04358 | -0.24098 |
| -0.00213 | -0.013809773 | -0.04571 | -0.05824 |
| 0.00663 | 0.042495549 | -0.03908 | 0.179206 |
| 0.003059 | 0.019345627 | -0.03602 | 0.081582 |
| 0.008731 | 0.054509471 | -0.02729 | 0.229869 |
| -0.0043 | -0.026501522 | -0.03159 | -0.11176 |
| -0.0015 | -0.009109098 | -0.03308 | -0.03841 |
| -0.00573 | -0.034452002 | -0.03881 | -0.14529 |
| -0.00754 | -0.044849697 | -0.04635 | -0.18913 |
| 0.007331 | 0.043093966 | -0.03902 | 0.181729 |
| -0.00133 | -0.007712371 | -0.04035 | -0.03252 |
| 0.005787 | 0.033268362 | -0.03456 | 0.140294 |
| 0.002375 | 0.013505702 | -0.03219 | 0.056954 |
| 0.001469 | 0.008267253 | -0.03072 | 0.034863 |
| -0.01244 | -0.069311939 | -0.04316 | -0.29229 |
| -0.00464 | -0.025604652 | -0.0478 | -0.10798 |
| 0.006473 | 0.035342656 | -0.04133 | 0.149042 |
TABLE 15: AAR’, CAAR’s, and their respective T-statistic values for event window.
SOURCE: The author.
NOTE: t-statistic is checked at 99%, 95%, and 90% confidence level.
The t-statistic is a statistical test that calculates the difference in a sample between an estimated parameter and its hypothesised value. It is used to examine whether the difference in means between two groups is statistically significant or simply due to chance. The t-statistic is computed by dividing the difference between the sample and hypothesised means by the standard error of the mean. The difference between the means is regarded statistically significant if the estimated t-value is greater than the critical value. The t-test is frequently used in hypothesis testing, regression analysis, and other statistical investigations to determine the significance of a difference between two groups' means.
The critical value (z) for 99% confidence level is 2.576*, for 95% confidence level it is 1.96**, and for 90% confidence level it is 1.645***
In the above table we can see that all the values are less than the critical value hence they are are insignificant to accept the null hypothesis.
When a t-test is found to be insignificant for the effect of vaccination drive on the hotel industry in Asia, it means that there is no significant difference between the means of the two groups being compared (in this case, pre and post vaccination drive period). In other words, the vaccination drive did not have a statistically significant effect on the hotel industry in Asia.
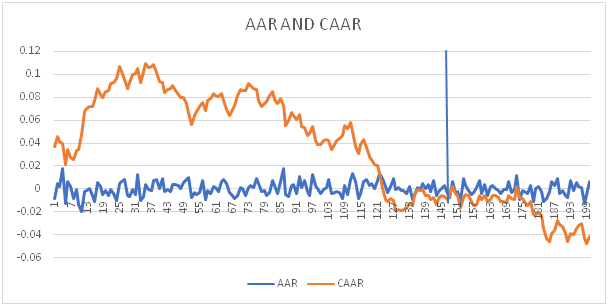
FIGURE 3: Graph of all the AAR’s and CAAR’s during the event window.
SOURCE: The author.
In the above we can see that the CAAR was in negative trend till the event day and just before the event day it started to stabilize, even after the event day the CAAR was stable for a while before falling down again. This shows that there were some other factors which affected the stock price like travel restrictions, government policies like lock downs etc.
This also highlights that the vaccination drive did not have a significant effect on the stock prices since they stabilized only for a while and also did not show any positive trend.
Conclusion
The current study aimed to ascertain the impact of the COVID-19 vaccination campaign on Asian hotel industry stocks. The study's findings revealed that, while news of the vaccination drive had a beneficial influence on stocks, the effect was not statistically significant. After the event day, the markets stabilised, but many other things could have influenced the study, such as travel restrictions in countries, which could affect the data set.
More research is required to investigate the impact of other factors on Asian hotel industry stocks. Further research could look into the influence of government policies like lockdowns and travel restrictions on hospitality industry stocks. Another topic of investigation might be the influence of the pandemic on consumer behaviour and spending habits in the hospitality industry.
While the findings of this study did not support the hypothesis that the COVID-19 vaccination drive had a significant impact on the hospitality industry stocks in Asia, it does suggest that other factors may play a more significant role in determining the performance of these stocks. Future research should continue to explore these factors and their impact on the hospitality industry in Asia to provide a more complete understanding of this important industry.
If the result of the study is insignificant, meaning that there is no significant impact of COVID-19 vaccination on the hotel industry stocks in Asia, the short-term and long-term implications of vaccination on the hotel industry in Asia may not be very different from the implications of the pandemic itself.
In the short term, hotel companies in Asia may face reduced service demand due to travel restrictions and reduced consumer confidence in travel. They may also face increased operational costs due to the need for health and safety protocols to prevent the spread of the virus.
In the long term, hotel companies may need to adapt to changing consumer preferences and behaviours in the post-pandemic world. This could include offering flexible booking policies, implementing more robust cleaning and hygiene protocols, and exploring new revenue streams such as remote work packages or virtual events.
Regardless of the impact of COVID-19 vaccination on the hotel industry stocks in Asia, hotel companies can still adapt to changing market conditions by improving operational efficiency, strengthening their digital capabilities, and building stronger relationships with customers. By doing so, they can position themselves to weather the ongoing challenges of the pandemic and emerge more robust in the post-pandemic world.
The conclusion of the study indicates that the news of the COVID-19 vaccination drive had a positive impact on the hospitality industry stocks in Asia, but the effect was not statistically significant. Factors such as travel restrictions and government policies might have a more significant impact on the industry's stocks. The study recommends further research on the impact of these factors on the hospitality industry stocks, and also the impact of the covid-19 pandemic on consumer behaviour and spending patterns.
REFERENCES
Chan, K. F., Chen, Z., Wen, Y., & Xu, T. (2021). COVID-19 Vaccines: Saving Lives and the Global Stock Markets. SSRN Electronic Journal. https://doi.org/10.2139/ssrn.3785533
Dileep, M., Ajoon, J., & Nair, B. B. (2022, March 9). COVID-19 and tourism stakeholders: experience, behaviour and transformation. Journal of Organizational Ethnography, 11(3), 275–293. https://doi.org/10.1108/joe-07-2021-0043
Dube, K. (2022). COVID-19 vaccine-induced recovery and the implications of vaccine apartheid on the global tourism industry. Physics and Chemistry of the Earth, Parts a/B/C, 126, 103140. https://doi.org/10.1016/j.pce.2022.103140
Gautam, P. (2021). The Effects and Challenges of COVID-19 in the Hospitality and Tourism Sector in India. Journal of Tourism and Hospitality Education, 11, 43–63. https://doi.org/10.3126/jthe.v11i0.38242
Gursoy, D., & Chi, C. G. (2020, July 3). Effects of COVID-19 pandemic on hospitality industry: review of the current situations and a research agenda. Journal of Hospitality Marketing & Management, 29(5), 527–529. https://doi.org/10.1080/19368623.2020.1788231
Gursoy, D., & Chi, C. G. (2020). Effects of COVID-19 pandemic on hospitality industry: Review of the current situations and a research agenda. Journal of Hospitality Marketing & Management, 29(5), 527-529, https://doi.org/10.1080/19368623.2020.1788231
Hervie, D. M., Amoako-Atta, E., Hossain, M. B., Illés, C. B., & Dunay, A. (2022, February 22). Impact of COVID-19 Pandemic on Hotel Employees in the Greater Accra Region of Ghana. Sustainability, 14(5), 2509. https://doi.org/10.3390/su14052509
Industry Outlook 2019-2021: Hotel Industry. (2019, July 31). krungsri.com. https://www.krungsri.com/en/research/industry/industry-outlook/services/hotels/io/industry-outlook-hotel
Jafari, K., Özduran, A., & Saydam, M. B. (2021, November 9). Hospitality and tourism industry amid COVID-19 pandemic: voices from small Mediterranean town. International Hospitality Review. https://doi.org/10.1108/ihr-07-2021-0054
Kohlmayr, K. (2021, September 15). The impact of vaccination rates on a hotel’s business recovery. Insights. https://insights.ehotelier.com/insights/2021/09/15/the-impact-of-vaccination-rates-on-a-hotels-business-recovery/
Oteng Agyeman, F., Ma, Z., Li, M., Kwasi Sampene, A., Adikah, I., & Frimpong Dapaah, M. (2022, August 24). Relevance of COVID-19 vaccine on the tourism industry: Evidence from China. PLOS ONE, 17(8), e0269200. https://doi.org/10.1371/journal.pone.0269200
Pak, A., Adegboye, O. A., Adekunle, A. I., Rahman, K. M., McBryde, E. S., & Eisen, D. P. (2020, May 29). Economic Consequences of the COVID-19 Outbreak: the Need for Epidemic Preparedness. Frontiers in Public Health, 8. https://doi.org/10.3389/fpubh.2020.00241
P-Values | BUSPH Learning Modules. (n.d.). P-Values | BUSPH Learning Modules. https://www.bumc.bu.edu/public-health-learning-modules/lessons/introduction-and-learning-objectives/p-values/
Rouatbi, W., Demir, E., Ackah, I., & Zaremba, A. (2021). Immunizing markets against the pandemic: COVID-19 vaccinations and stock volatility around the world. International Review of Financial Analysis, 77, 101819. https://doi.org/10.1016/j.irfa.2021.101819
Sectoral impact, responses and recommendations (COVID-19 and the world of work). (n.d.). Sectoral Impact, Responses and Recommendations (COVID-19 and the World of Work). https://www.ilo.org/global/topics/coronavirus/sectoral/lang--en/index.htm
Singh, B., Dhall, R., Narang, S., & Rawat, S. (2020, October 1). The Outbreak of COVID-19 and Stock Market Responses: An Event Study and Panel Data Analysis for G-20 Countries. Global Business Review, 097215092095727. https://doi.org/10.1177/0972150920957274
To, B. C. N., Nguyen, B. K. Q., & Van Thien Nguyen, T. (2023). When the market got the first dose: Stock volatility and vaccination campaign in COVID-19 period. Heliyon, 9(1), e12809. https://doi.org/10.1016/j.heliyon.2023.e12809
Uddin, M., Chowdhury, A., Anderson, K., & Chaudhuri, K. (2021, May). The effect of COVID – 19 pandemic on global stock market volatility: Can economic strength help to manage the uncertainty? Journal of Business Research, 128, 31–44. https://doi.org/10.1016/j.jbusres.2021.01.061
Vu, H. D., Nguyen, A. T. N., Nguyen, N. T. P., & Tran, D. B. (2022, March 30). Impacts and restoration strategy of the tourism industry post-COVID-19 pandemic: evidence from Vietnam. Journal of Tourism Futures. https://doi.org/10.1108/jtf-09-2021-0218
Wang, Y. C., & Chen, T. C. T. (2022, November). Analyzing the impact of COVID-19 vaccination requirements on travelers’ selection of hotels using a fuzzy multi-criteria decision-making approach. Healthcare Analytics, 2, 100064. https://doi.org/10.1016/j.health.2022.100064
Williams, N. L., Nguyen, T. H. H., Del Chiappa, G., Fedeli, G., &Wassler, P. (2021). COVID-19 vaccine confidence and tourism at the early stage of a voluntary mass vaccination campaign: a PMT segmentation analysis. Current Issues in Tourism, 25(3), 475–489. https://doi.org/10.1080/13683500.2021.1963216
About Anubha Srivastava
Anubha Srivastava is a proven academician, keynote speaker, and corporate trainer with over 13 years of experience in India, Indonesia, and Africa. Currently a Consultant for PT. DJerapah Magah Plasindha and a Visiting Faculty at Universitas Diponegoro and UNNES in Indonesia, she has played pivotal roles in academic and training initiatives such as the Pan Africa e-network project. With an illustrious academic background from institutions like Harvard Business Schoolx and Amity University, she has shared her expertise with entities like TATA Motors, NTPC, and the Indian Army. Additionally, she has published over 28 research papers in reputable journals, served as an editor and peer reviewer for acclaimed publications, and been a keynote speaker at international conferences.
Disclaimer : The opinions expressed in this article are the personal opinions of the author. The facts and opinions appearing in the article do not reflect the views of Indiastat and Indiastat does not assume any responsibility or liability for the same.
.png)


.png)