
1. INTRODUCTION
MSE-CDP scheme is one of the flagship schemes of Ministry of MSME. Under the scheme various Sustainable Development Goals (SDG) were served in past few years. Some of the key SDG goals serves are as follows: (i) Industry, Innovation and Infrastructure: Under the scheme Ministry of MSME has provided grant to MSMEs for setting up of state-of-the-art machines and equipment’s thus helping them bring innovation in the work which is being performed by them. One of the examples is introduction of new machines at Turmeric Cluster in Sangli, which resulted in doubling the export value from the cluster. (ii) Gender Equality: Introduction of new machines in Readymade Garment Cluster, Nagpur thus empowering more than 1000 women by providing them training and making them self-reliant. (iii) Reduced Inequality: CFCs are enabling micro and small enterprises to start exporting from clusters. One such example is of Readymade garment cluster in Hubli which has become a role model for Government of Karnataka to replicate, especially in economically backward areas. O/o DC (MSME) is monitoring ongoing project and completed projects through digitally mode by website and appointed CDOs (Cluster Development Officers) for monitoring and keeping with touch with State Governments for timely implementation. CFC/ID projects are demand driven and are providing the common facilities to MSEs Sector for making quality products. (NPC, 2023). Ministry of MSME, Government of India is implementing Infrastructure Development Program like Micro & Small Enterprises Cluster Development (MSE-CDP).
2. METHODS AND DATA
Objectives of the Study
Methodology of the Study
The methodology adopted is collection of secondary data from website of Udayam Registration and Ministry of MSME, Government of India and Cluster website (Bhaskaran E. , The Productivity and Technical Efficiency of Textile Industry Clusters in India, 2013). The data collected were analysed using Business Analytics like diagnostic analysis, descriptive analysis, predictive analysis, inferential analysis, prescriptive analysis and decision analytics by using statistical analysis like CAGR, descriptive analysis, correlation analysis, regression analysis and structural equation modelling by taking input variables like no. of clusters, no. of working enterprises, employment generated, value of plant and machinery in Rs. Crores, Market value of fixed assets in Rs. Crores and Gross Value of Fixed assets in Rs. Crores. The data were compared with Common Facility Centre approved (CFCa), CFC in progress (CFCp), CFC Completed (CFCc), Infrastructure Development approved (IDa), Infrastructure Development in progress (IDp), Infrastructure Development Completed (IDc) and output variables like Total CFC and ID (CFC_ID_T) and No. of Clusters (Cn). The data are also collected from the journal publications. (Bhaskaran E. , The Technical Efficiency of Engineering Industry Cluster at Hosur, 2019). (Bhaskaran E. , The Technical Efficiency of Chennai Auto Industry Cluster, 2011). The conceptual frame work developed by researcher is given in figure 1.
Figure 1: Conceptual Framework for MSME Clusters
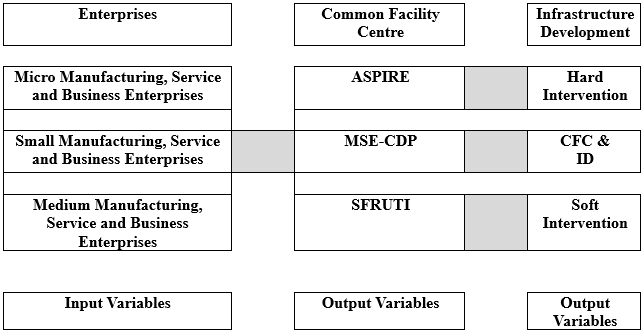
Source: Developed by Researcher
3. RESULTS AND BUSINESS ANALYTICS
Diagnostic Analysis
MSMEs in India
The MSMEs in India is given in figure 2. (MoMSME, 2023)
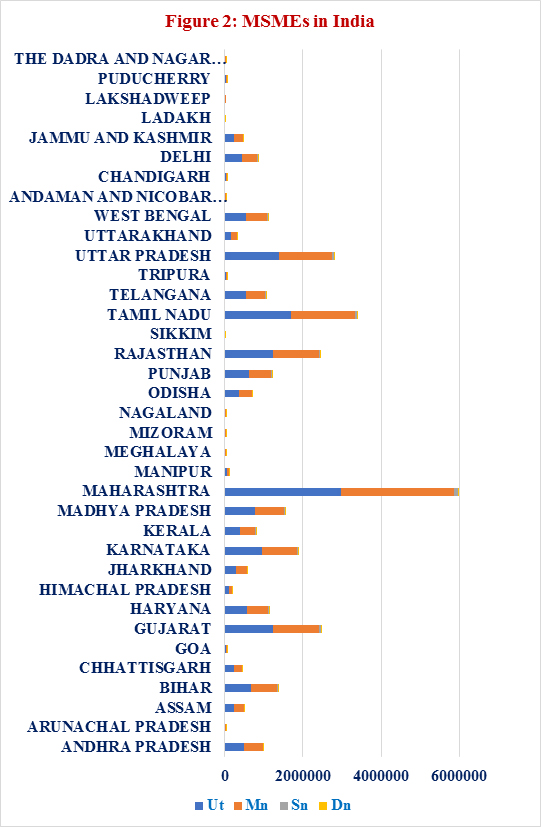
Source: (MoMSME, 2023)
The physical performance of MSMEs is given in figure 2 where Maharashtra has got a greater number of MSMEs followed by Tamil Nadu and Gujarat.
Definition of MSME
As per MSMED Act 2006 the definition of MSME is given in table 1. (DCMSME, 2022).
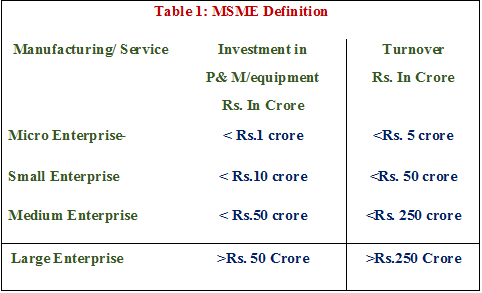
Source: (DCMSME, 2022)
Total URC and share of MSMEs
Total URC and share of MSMEs are given in figure 3.
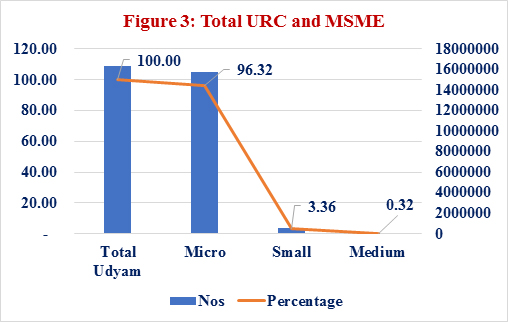
Source: (DCMSME, 2022)
As per figure 3 in India there are 96.32 percentage are Micro enterprises, 3.36 percentage are small enterprises and 0.32 are medium enterprises.
Manufacturing and Service Enterprises
The manufacturing and service enterprises percentage are given in figure 4.
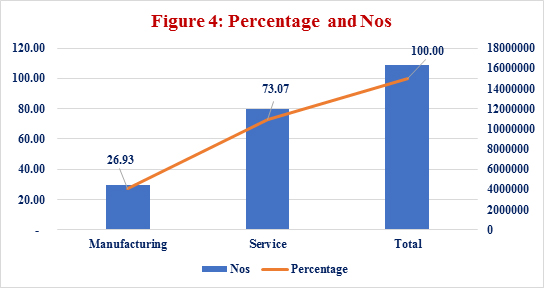
Source: (DCMSME, 2022)
As per figure 4 the percentage of manufacturing enterprises in India is 26.93 percent and service enterprises is 73.07 percent.
Total employment and women employment
Total employment and women employment is given in figure 5.
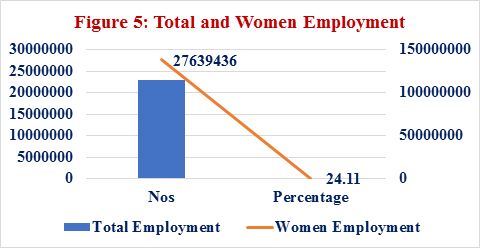
Source: (DCMSME, 2022)
As per figure 5, the women employment percentage is 24.11 percent out of total employment.
Physical and Financial Performance of MSMEs Export in India.
The export performance of MSMEs in India is given in figure 6.
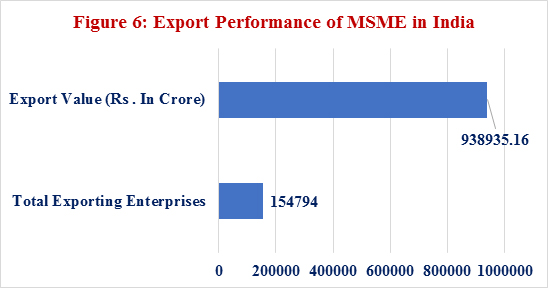
Source: (DCMSME, 2022)
As per figure 6, the physical export performance of MSMEs in India is 1, 54,794 enterprises i.e., one percent only and the financial performance of export value is Rs. 938935.16 crores.
MSME Clusters in India
MSME Clusters in India is given in figure 7 (Cluster, 2023)
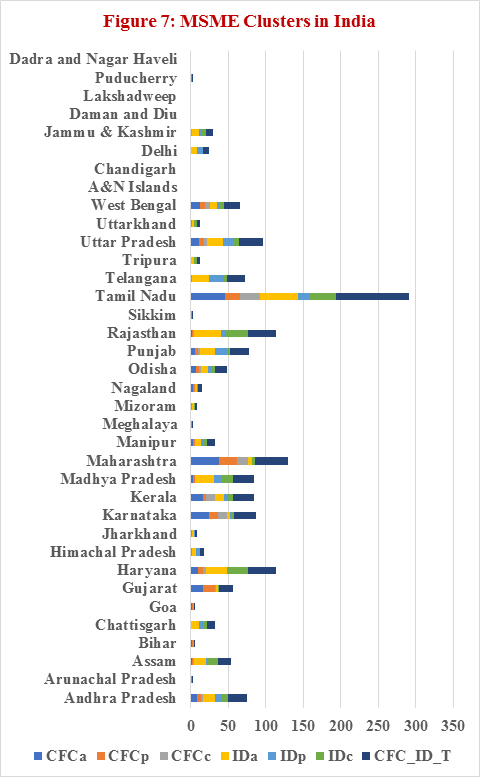
Figure 7 exposes about the CFCa, CFCp, CFCc, IDa, IDp, IDc, and total CFC_ID_T in various states of India.
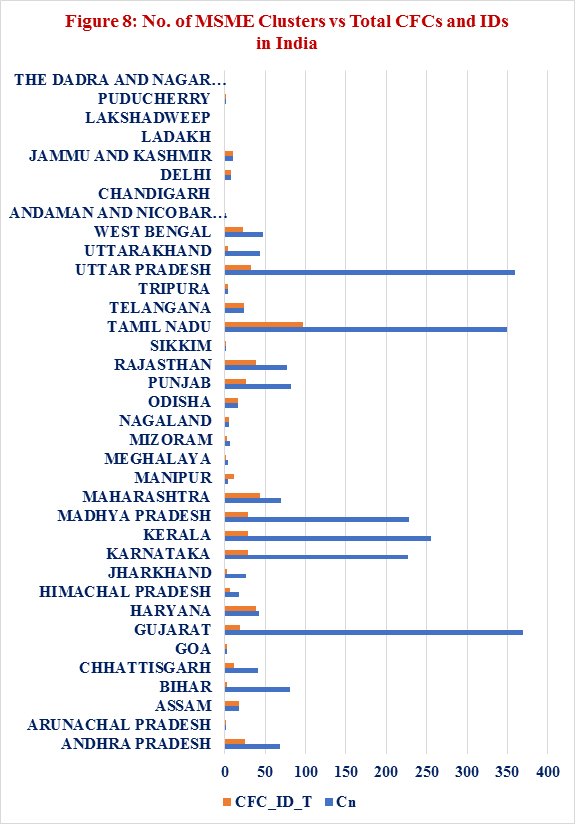
No. of MSME Clusters and Total CFCs and IDs in India
As per fourth All India Census ((MSME), 2006) the no. of Clusters available in India and the total CFCs and IDs approved are given in figure 8.
4. DISCUSSION
Descriptive Analysis
The descriptive analysis is given in table 2.

Source: Computed data
As per table 2 it is observed that the CFC and ID should be developed more in some districts when compared to number of micro and small enterprises available in India.
Correlation Analysis
The correlation analysis is given in table 3.
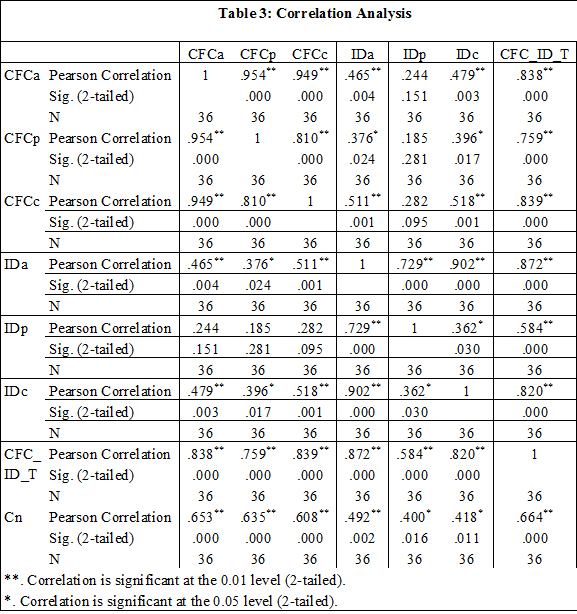
Source: Computed data
Inferential Analysis
The inference analysis is given in the form of hypothesis testing.
Null Hypothesis 1: There is no significant relationship between CFC approved and CFC in process.
Alternate Hypothesis 1: There is significant relationship between CFC approved and CFC in process.
As per table 3, Correlation Coefficient (r) = .954**, p = .000 hence null hypothesis is rejected and alternate hypothesis is accepted. There is significant and strong relationship between CFC approved and CFC in process.
Null Hypothesis 2: There is no significant relationship between CFC approved and CFC completed.
Alternate Hypothesis 2: There is significant relationship between CFC approved and CFC completed.
As per table 3, Correlation Coefficient (r) = .949**, p = .000 hence null hypothesis is rejected and alternate hypothesis is accepted. There is significant and strong relationship between CFC approved and CFC completed.
Null Hypothesis 3: There is no significant relationship between CFC approved and Total no. of Infrastructure projects (CFC_ID_T).
Alternate Hypothesis 3: There is significant relationship between CFC approved and Total no. Infrastructure projects (CFC_ID_T).
As per table 3, Correlation Coefficient (r) = .949**, p = .000, hence null hypothesis is rejected and alternate hypothesis is accepted. There is significant relationship between CFC approved and Total no. Infrastructure projects (CFC_ID_T).
Null Hypothesis 4: There is no significant relationship between ID approved and ID in process.
Alternate Hypothesis 4: There is significant relationship between ID approved and ID in process.
As per table 3, Correlation Coefficient (r) = .729**, p = .000 hence null hypothesis is rejected and alternate hypothesis is accepted. There is significant and moderate relationship between ID approved and ID in process.
Null Hypothesis 5: There is no significant relationship between ID approved and ID completed.
Alternate Hypothesis 5: There is significant relationship between ID approved and ID completed.
As per table 3, Correlation Coefficient (r) = .902**, p = .000 hence null hypothesis is rejected and alternate hypothesis is accepted. There is significant and strong relationship between ID approved and ID completed.
Null Hypothesis 6: There is no significant relationship between ID approved and Total no. of Infrastructure projects (CFC_ID_T).
Alternate Hypothesis 6: There is significant relationship between ID approved and Total no. Infrastructure projects (CFC_ID_T).
As per table 3, Correlation Coefficient (r) = .872**, p = .000, hence null hypothesis is rejected and alternate hypothesis is accepted. There is significant and strong relationship between ID approved and Total CFC and ID.
Null Hypothesis 7: There is no significant relationship between Total CFC and ID (CFC_ID_T) and No. of Clusters (Cn).
Alternate Hypothesis 7: There is significant relationship between Total CFC and ID (CFC_ID_T) and No. of Clusters (Cn).
As per table 3, Correlation Coefficient (r) = .664**p = .000, hence null hypothesis is rejected and alternate hypothesis is accepted. There is significant and moderate relationship between Total CFC and ID (CFC_ID_T) and No. of Clusters (Cn).
Regression Analysis / Predictive Analysis
Null Hypothesis 8: There is no significant difference between no. of clusters available in India and no. of CFCs and IDs approved.
Alternate Hypothesis 8: There is significant difference between no. of clusters available in India and no. of CFCs and IDs approved.
CFC_ID_T = 7.460 + 0.116 Cn, p = 0.000, R2 =0.441 [1]
As per equation [1] for one unit increase in No. of Clusters there is 0.12 unit increase in Total CFC and ID.
The regression histogram is given in figure 9 and regression graph is given in figure 10.
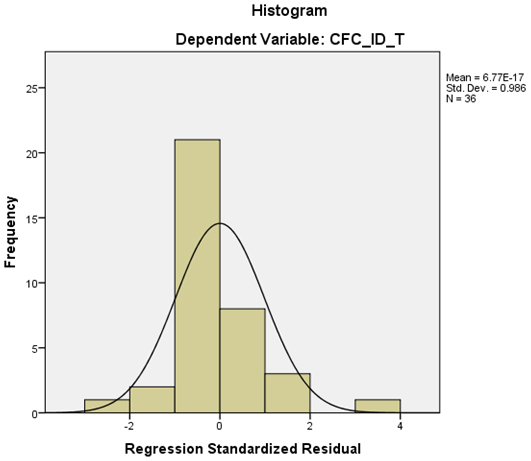
Figure 9: Regression Histogram
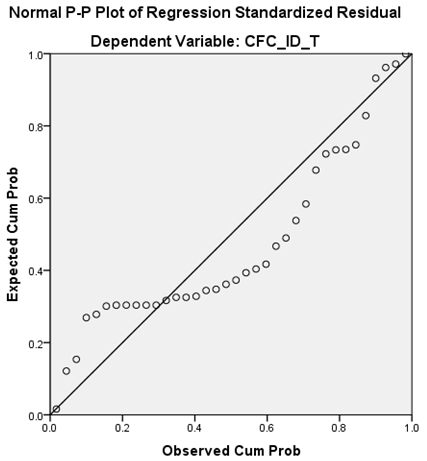
Figure 10: Regression Graph
Structural Equation Modelling (SEM)
The SEM graph for Standardised Estimates is given in figure 11.
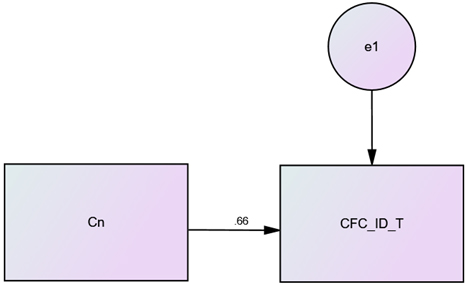
Figure 11 SEM Standardised Estimates
The SEM graph for Unstandardized Estimates is given in figure 12.
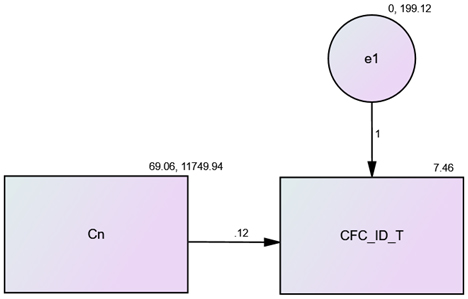
Figure 12: SEM Unstandardized Estimates
Structural Equation Modelling Results are given in Table 4.
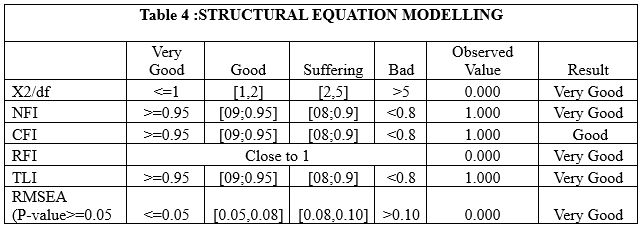
Source: Computed data
Null Hypothesis 9: There is no significant difference between CFC approved and CFC completed.
Alternate Hypothesis 9: There is significant difference between CFC approved and CFC completed.
CFCc = -.425 + 0.485 CFCa, p=0.000, R2 = 0.900 [2]
As per equation [2] for one unit increase in CFC approved there is 0.485 unit increase in CFC completed.
The regression histogram is given in figure 13 and regression graph is given in figure 14.
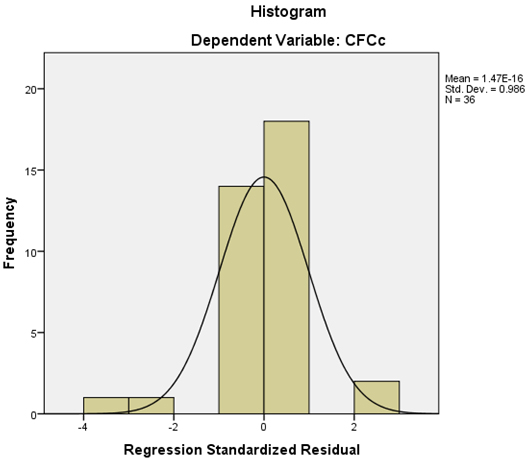
Figure 13: Regression Histogram

Figure 14: Regression Graph
Null Hypothesis 10: There is no significant difference between ID approved and ID completed.
Alternate Hypothesis 10: There is significant difference between ID approved and ID completed.
IDc = -0.607 + 0.662 IDa, p= 0.000, R2 = 0.813 [3]
As per equation [3] for one unit increase in ID approved there is 0.662 unit increase in ID completed. The regression histogram is given in figure 14 and regression graph is given in figure 15.
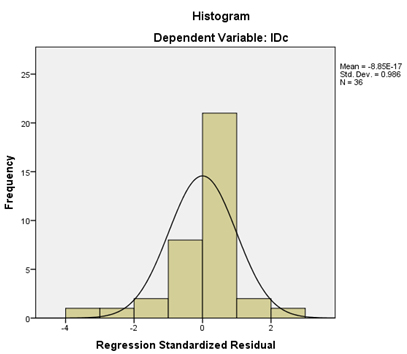
Figure 14: Regression Histogram
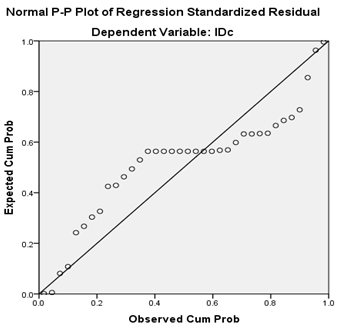
Figure 15: Regression Graph
5. CONCLUSION
Micro, Small Enterprises Cluster Development Programme (MSE-CDP) is one of the flagship schemes of Ministry of MSME for creation of Common Facility Centre and Infrastructure Development. Under the scheme various Sustainable Development Goals (SDG) were served in past few years including Goal No.8, "Decent work and economic growth" and Goal No.9, Industry, Innovation and Infrastructure. Under the scheme Ministry of MSME has provided grant to MSMEs for setting up of state-of-the-art machines and equipment’s thus helping them bring innovation in the work which is being performed by them. The Objectives to study on the State Wise performance of MSME in India, to study on the State Wise performance of MSME Clusters in India and to compare the performance of MSME based on MSME Clusters in India has shown interesting results.
Maharashtra has got a greater number of MSMEs followed by Tamil Nadu and Gujarat. In India, 96.32 percentage are Micro enterprises, 3.36 percentage are small enterprises and 0.32 are medium enterprises. The percentage of manufacturing enterprises in India is 26.93 percent and service enterprises is 73.07 percent. The women employment percentage is 24.11 percent out of total employment. The physical export performance of MSMEs in India is 1, 54, 794 enterprises i.e., one percent only and the financial performance of export value is Rs. 938935.16 crores. There is need of improvement in MSME exports. According to fourth all India census there are 2443 MSME clusters in India out of which 557 MSME clusters only i.e., 23 per cent have got funding under MSE-CDP for Common Facility Centre and Infrastructure Development. The remaining MSME clusters need either State Government funding or central Government funding to achieve the sustainable development goal 8 and 9. Correlation Coefficient (r) = .664**p = .000, and there is significant and moderate relationship between Total CFC and ID and No. of Clusters in India which needs improvement. For one unit increase in No. of Clusters there is 0.12 units increase in Total CFC and ID. For one unit increase in CFC approved there is 0.485 unit increase in CFC completed. For one unit increase in ID approved there is 0.662 unit increase in ID completed.
To conclude to achieve the SDG 8 and 9 goals in India, there is need for more improvement in decent work, economic growth, Industry, Innovation, and Infrastructure of Industrial Clusters which leads to improvement in MSMEs growth.
ACKNOWLEDGEMENT
The author acknowledges Department of Industries and Commerce, Government of Tamil Nadu for sending him for UNIDO’s Cluster Development Agent (CDA) training at EDII, Ahmedabad sponsored by UNIDO, New Delhi and acknowledges Tamil Nadu Small Industries Development Corporation (TANSIDCO) for guidance and also acknowledges University of Madras for giving Ph.D. on Industrial Cluster Development Approach in Management Sciences.
References
(MSME), D. C. (2006). Ministry of Micro, Small & Medium Enterprises. Retrieved from Final Report of Fourth All India Census of Registered MSMEs Sector: https://www.dcmsme.gov.in/publications/FinalReport010711.pdf
Bhaskaran, E. (2008). A Study on the Performance of Micro and Small Enterprises in Tamilnadu. SEDME (Small Enterprises Development, Management & Extension Journal), SAGE, 35(4), 61–71. doi:https://doi.org/10.1177/0970846420080405
Bhaskaran, E. (2011). The Technical Efficiency of Chennai Auto Industry Cluster. Society of Automotive Engineers (SAE), 2011-28-0100. doi:10.4271/2011-28-0100
Bhaskaran, E. (2013). The Productivity and Technical Efficiency of Textile Industry Clusters in India. Journal of The Institution of Engineers (India): Series C, 94(3), 245-251. doi:10.1007/s40032-013-0073-1
Bhaskaran, E. (2019). The Technical Efficiency of Engineering Industry Cluster at Hosur. SEDME (Small Enterprises Development, Management & Extension Journal): A worldwide window on MSME Studies, 46(2), 100-116. doi:10.1177/0970846419852518
Cluster, M. (2023). Development Commissioner, Micro Small and Medium Enterprises. Retrieved from Government of India: https://cluster.dcmsme.gov.in/
DCMSME. (2022). Development Commissioner, Micro, Small and Medium Enterprises. Retrieved from Government of India: https://www.dcmsme.gov.in/UDYAM_Publication_with_tables_final20220622.pdf
GOI. (2023). Ministry of Micro Small and Medium Enterprises (MoMSME), Government of India. Retrieved from Micro & Small Enterprises Cluster Development (MSE-CDP): https://msme.gov.in/infrastructure-development-program
MoMSME. (2023). Udyam Registration Certificate. Retrieved from Micro Small and Medium Enterprises: https://udyamregistration.gov.in/Government-India/Ministry-MSME-registration.htm
NPC, N. P. (2023). Evaluation Study of Micro & Small Enterprises Cluster Development Program (MSE-CDP). Retrieved from Ministry of Micro,Small and Medium Enterprises, Government of India: https://www.dcmsme.gov.in/schemes/Evaluation-Study-of-MSE-CDP-by-NPC.pdf
Disclaimer : The opinions expressed within this interview are the personal opinions of the interviewee. The facts and opinions appearing in the answers do not reflect the views of Indiastat or the interviewer. Indiastat does not hold any responsibility or liability for the same.
.png)


.png)